Tool showcase
To showcase the toolbox applications and facilitate an understanding of the methods, we build in example datasets for SMRT and ONT analyses in MeMoRe app. Typical analysis results for both SMRT and ONT datasets are presented below.
Principle
In Bacteria and Archaea, DNA methylation events (6mA, 4mC, 5mC) are motif-driven, meaning that nearly all occurrences of the same sequence motif(s) will be modified. This property can be used to refine the motifs discovered from SMRTPortal/SMRTLink Base Modification Analysis or nanodisco pipelines.
For each methylation motif de novo discovered, we identify all occurrences in the provided reference genome, and we aggregate the methylation signal to provide a simple visual representation for motif sequence validation. The same procedure is repeated for all related motifs with one substitution to confirmed that the methylation is precisely represented by a the motif of interest. For example, considering GATC de novo discovered, we also extract the methylation signal for:
1st base substitution: AATC, CATC, TATC.
2nd base substitution: GCTC, GGTC, GTTC.
3rd base substitution: GAAC, GACC, GAGC.
4th base substitution: GATA, GATG, GATT.
Analysis of SMRT results
In SMRT sequencing, DNA methylation affect the kinetics of the polymerases during real-time DNA synthesis. The changes of polymerase’s kinetics are observed through the Inter-Pulse Duration (IPD) metric which are compared to prediction from an in silico model at each genomic position. The resulting metric is called the IPD ratio (IPD native/IPD in silico). For 6mA and 4mC DNA modification, the IPD ratio increase on top of the methylated positions while an IPD ratio of 1 means no kinetic change. It is worth noting that 5mC do not typically produce detectable signal and cannot be reliably found from SMRT data.
The following figure showcase a typical MeMoRe results for GTAT6mAC methylation motif in a C. perfringens strain. It shows high values only for the IPD ratios and for the Score from the motif of interest (i.e. GTATAC), while the related motifs (with one substitution) have metrics at background levels (~1 for the IPD ratio and ~0 for the Score).

Figure 1: MeMoRe results for SMRT dataset of C. perfringens’s GTAT6mAC methylation motif. Three metrics are visualized: top. IPD ratio distribution, middle. Score distribution, bottom. Coverage distribution.
Analysis of ONT results
In ONT sequencing, DNA methylation affect the electric current measured while the DNA molecules transfers through the nanopores. Using nanodisco, current differences between the native and the Whole Genome Amplified samples are computed at each genomic position and this metric represent the methylation signal for ONT dataset. The further from 0 the current difference are, the more likely the genomic is modified. Contrary to SMRT sequencing, the signal is broadly distributed and not restricted to the modified base, meaning that signal for multiple genomic positions needs to be monitored.
The following figure showcase a typical MeMoRe results for GTAT6mAC methylation motif in a C. perfringens strain. It shows disturbed current differences only from the motif of interest (i.e. GTATAC), while the related motifs (with one substitution) have current difference at background levels (distribution centered around zero). This characteristic is described in details in Tourancheau et al., 2021.
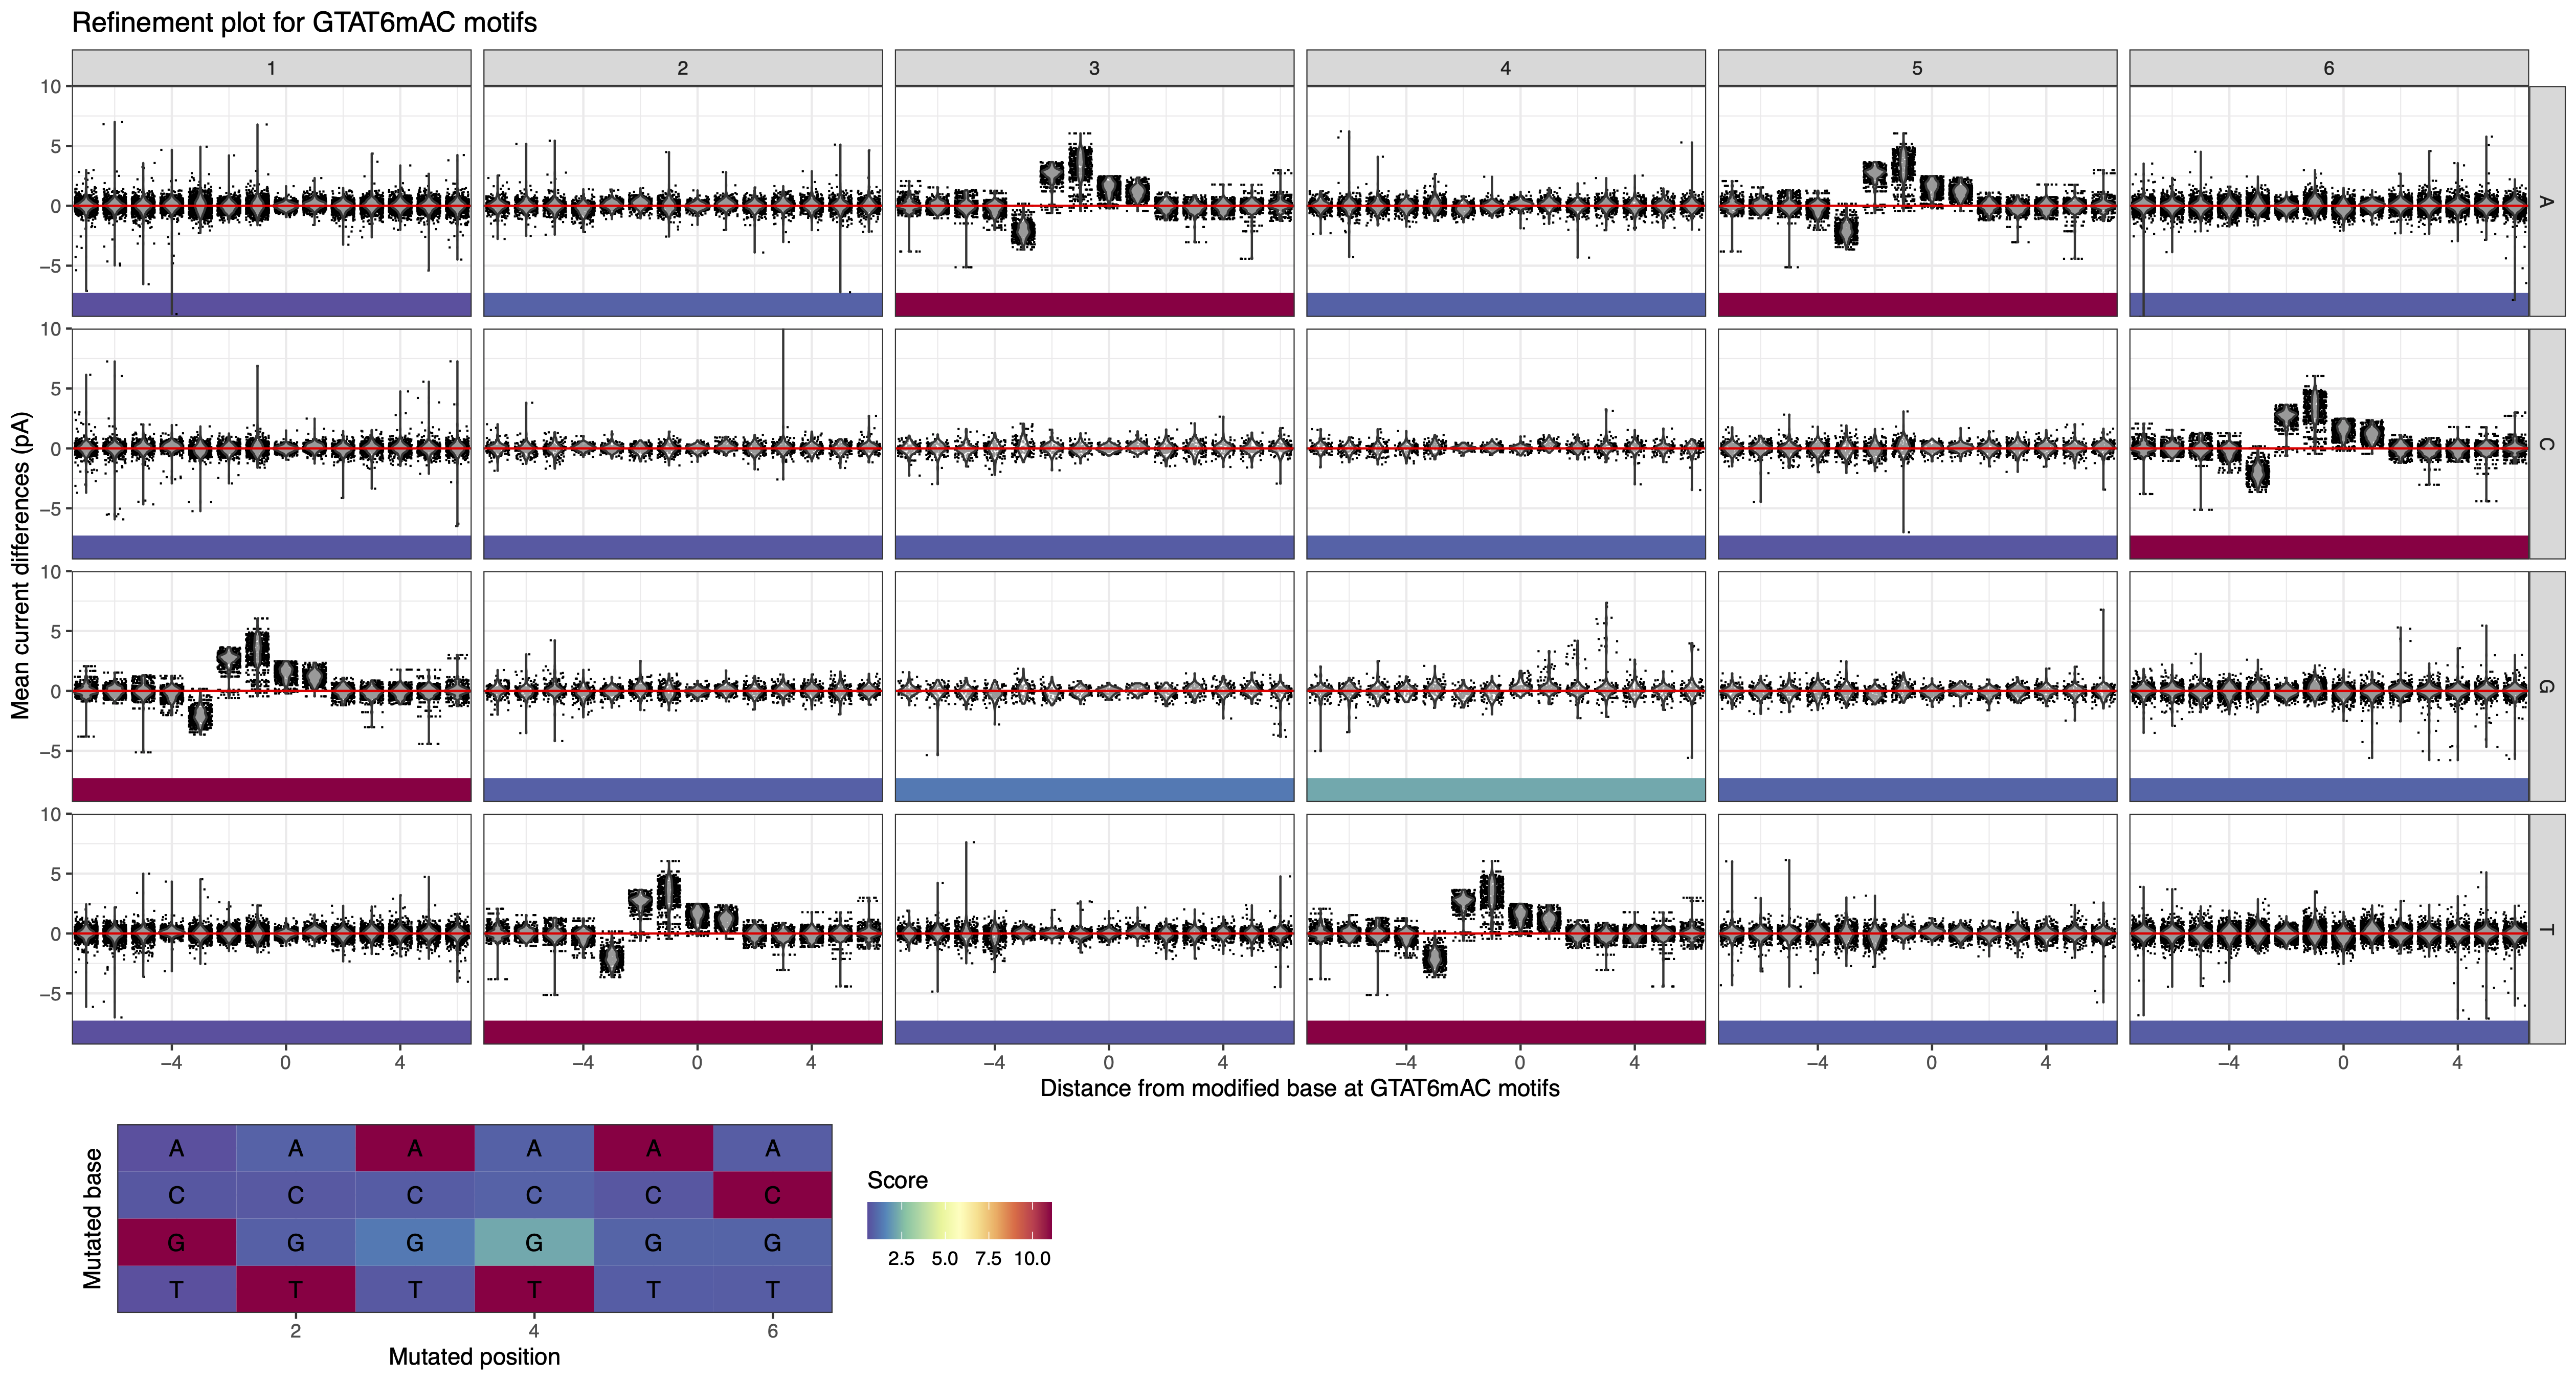
Figure 2: MeMoRe results for ONT dataset of C. perfringens’s GTAT6mAC methylation motif. Two metrics are visualized: top. Current differences distribution, bottom. Methylation motif score